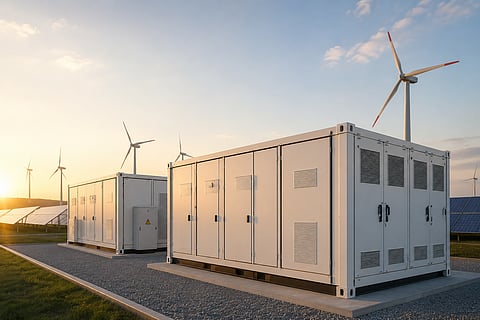


Using 15-minute grid and market data, an EAC-PM working paper finds India's summer evening net-load ramp doubled to 74 GW by May 2026. Halving that ramp would require 130 GWh of discharge, against average daily storage output of 23.8 GWh, with the shortfall concentrated in batteries.
Click here for a quick project snapshot
The Economic Advisory Council to the Prime Minister's Working Paper Series has published an analysis of India's changing electricity demand and net-load patterns. Written by Sanjeev Sanyal and Satvik Dev, the July 2026 paper uses Grid-India SCADA data and Indian Energy Exchange prices recorded at 15-minute intervals. It examines individual days, monthly averages, and comparable seasonal patterns to assess how rising solar penetration is changing the grid's flexibility requirements.
India’s electricity demand met climbed from 224.1 GW at 8:00 AM to a record 270.8 GW at 3:45 PM on May 21, 2026. Day-ahead market electricity cleared at INR 1.56/kWh for delivery at 1:00 PM before reaching the INR 10/kWh price ceiling at 6:30 PM, after solar generation had fallen. The paper describes this divergence between the timing of peak demand and peak prices as a characteristic of the evolving grid.
The analysis identifies a duck curve in India’s summer net-load profile, as solar generation depresses midday demand before a rapid evening increase. The average summer evening ramp climbed from approximately 36 GW in May 2023 to 74 GW in May 2026, while the morning ramp-down rose from 18 GW to 53 GW. India’s winter profile instead forms a double-peaked Bactrian camel curve, with a solar-backed midday trough separating the morning and evening peaks. The morning decline measured 64.03 GW in January 2026, while the evening increase reached 64.69 GW.
Market data reinforce the timing imbalance. The average May midday price declined from INR 2.81/kWh in 2023 to INR 1.11/kWh in 2026, while the evening peak increased from INR 8.08/kWh to INR 9.71/kWh. The intraday spread widened from INR 5.27/kWh to INR 8.60/kWh, producing a peak-to-trough ratio approaching 9 times. Solar curtailment averaged 24 GWh per day in May 2026. During April and May, shortages occurred at the non-solar-hour peak on 36 of 61 days, compared with six days during the solar-hour peak.
Halving an average summer evening ramp would demand around 130 GWh of discharge between 1:00 PM and 8:00 PM. From May 10 to May 31, 2026, India’s pumped-storage and battery assets supplied an average daily discharge of approximately 23.8 GWh. The National Electricity Plan assessed the 2026-27 storage requirement at 16.13 GW, with 7.45 GW expected from pumped storage and 8.68 GW from batteries. Pumped-storage capacity had risen to about 7.2 GW, while BESS capacity remained at 0.27 GW on January 31, 2026, before later commissioning increased it to 2.7 GW.
The paper supports writing energy storage into the Electricity Act and the statutory definition of the power system. It also examines contracts for difference, a nationally floored non-fossil purchase obligation, a default penalty of INR 0.35/kWh to INR 0.45/kWh, demand response, and time-of-day tariffs. The draft rules set deadlines of April 1, 2027, for commercial and industrial consumers above 10 kW and April 1, 2028, for other non-agricultural consumers. They would also allow regulators to mandate storage for prosumer renewable installations exceeding 500 kW.